Location:
PMKI > Stakeholder
Management > Stakeholder Circle®
Help - Visualization.


- Stakeholder Circle®
Overview
- The Stakeholder Circle®
- Visualization
- Creating the Stakeholder Circle
- Reading the Stakeholder Circle
Other related sections of the PMKI:
- Stakeholder Circle
Methodology - Visualization
- Advanced Stakeholder
Engagement
- The Stakeholder Relationship
Management Maturity Model (SRMM®).
 The
Stakeholder Work Sheet (SWS) is a sophisticated Excel
spreadsheet built to implement the Stakeholder Circle®
methodology - see
more on the SWS. Instructions on visualizing the
activity's stakeholders are included below.
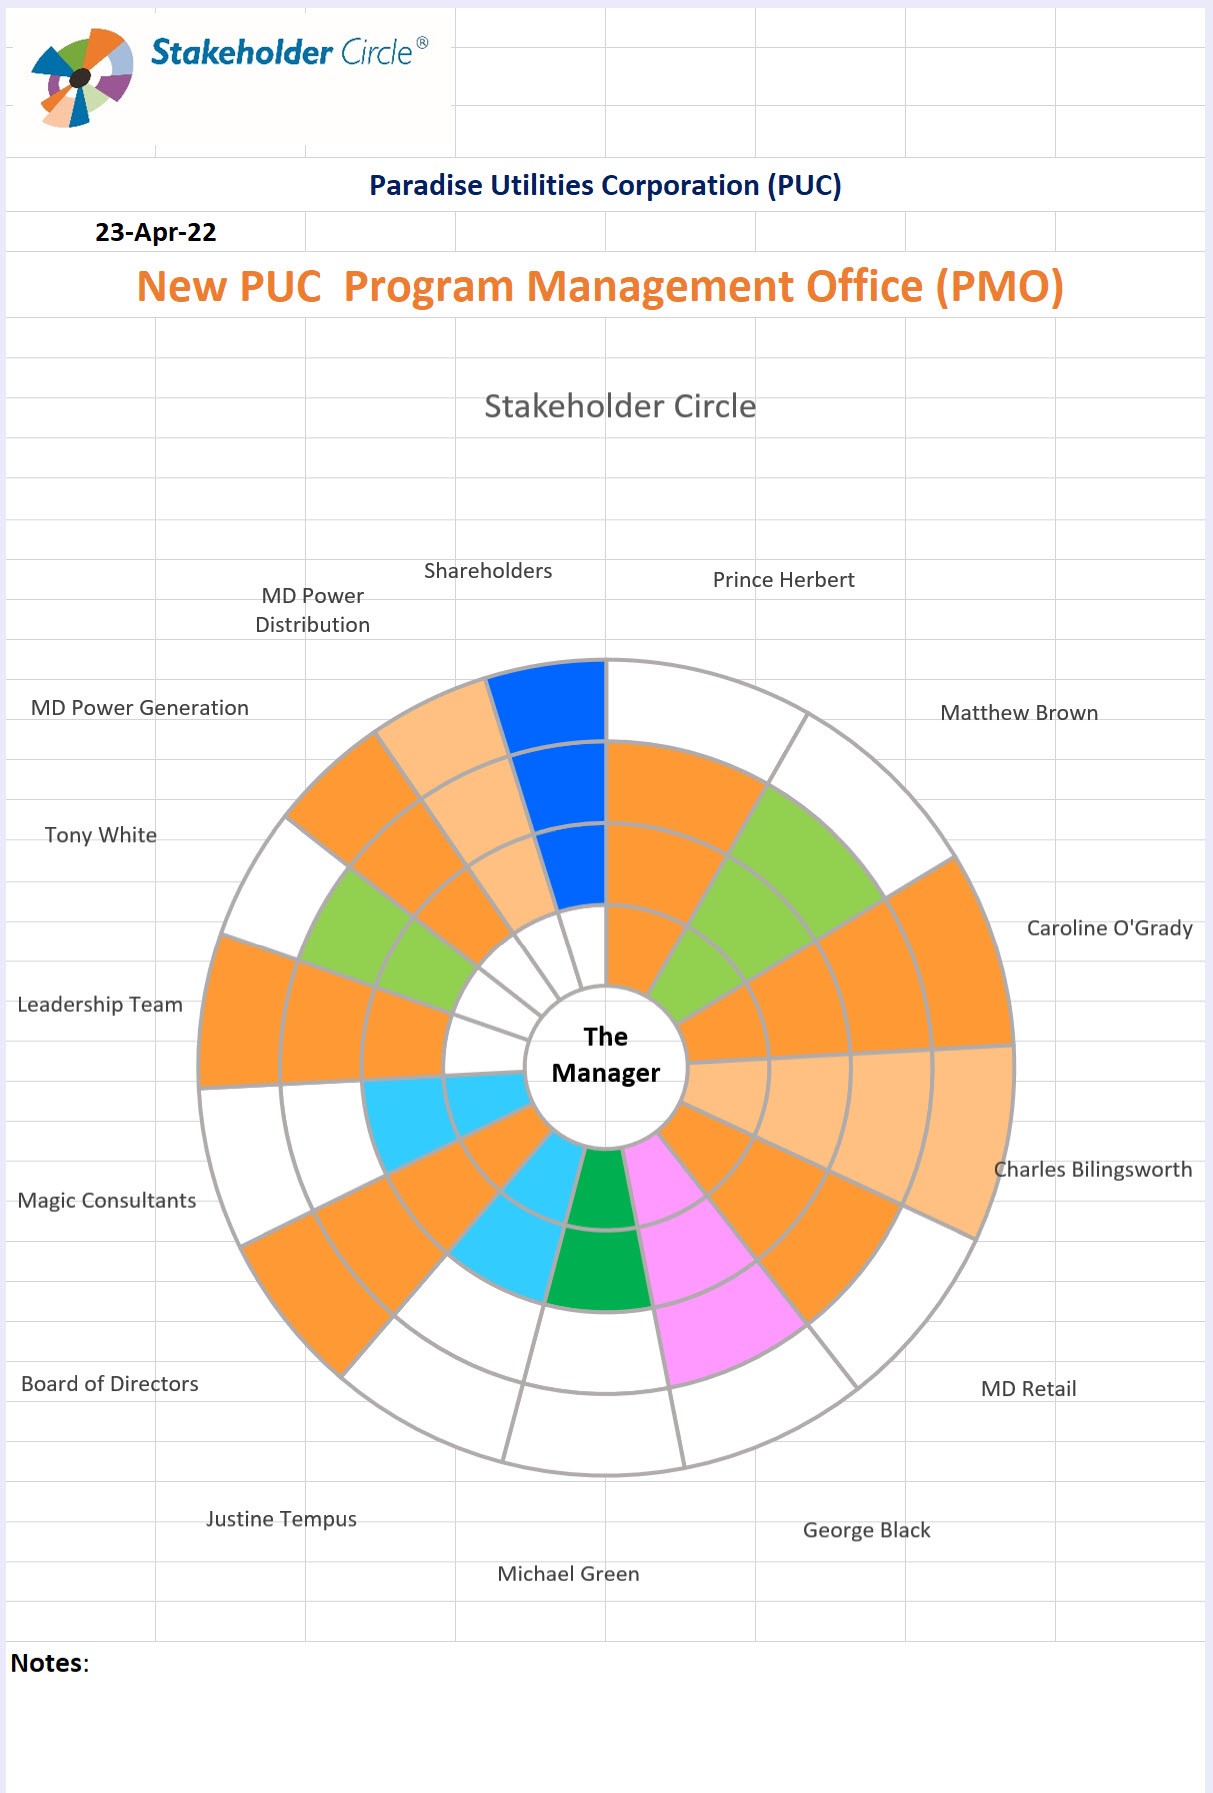
The top 15 stakeholders are mapped into a symbolic stakeholder community, depicting their relative importance through, color coding, and the size and placement of the segments of the circle. The Stakeholder Circle provides valuable pictorial information to assist in understanding the stakeholder community at a specific point in time and is the key to targeting the right stakeholders at the right time in the life of the activity and providing them with the right level of engagement, information and communication.
The Stakeholder Circle will show up to 15 stakeholders. This number was selected based on theories associated with span of command, a practical view of the reasonable maximum number of stakeholders a manager can actively engage with, and the need to produce a usable diagram that is not too complex. While the actual Stakeholder Circle is limited to 15 stakeholders:
Note: If your spreadsheet includes less than 15 stakeholders, the Stakeholder Circle will still be generated using all of the available entries, if the stakeholder list exceeds 15, the Stakeholder Circle will always display the top 15 based on priority.
The Stakeholder Circle, is updated and printed from the Visualization tab. The data displayed on opening the tab is the last stakeholder circle created in the tool.
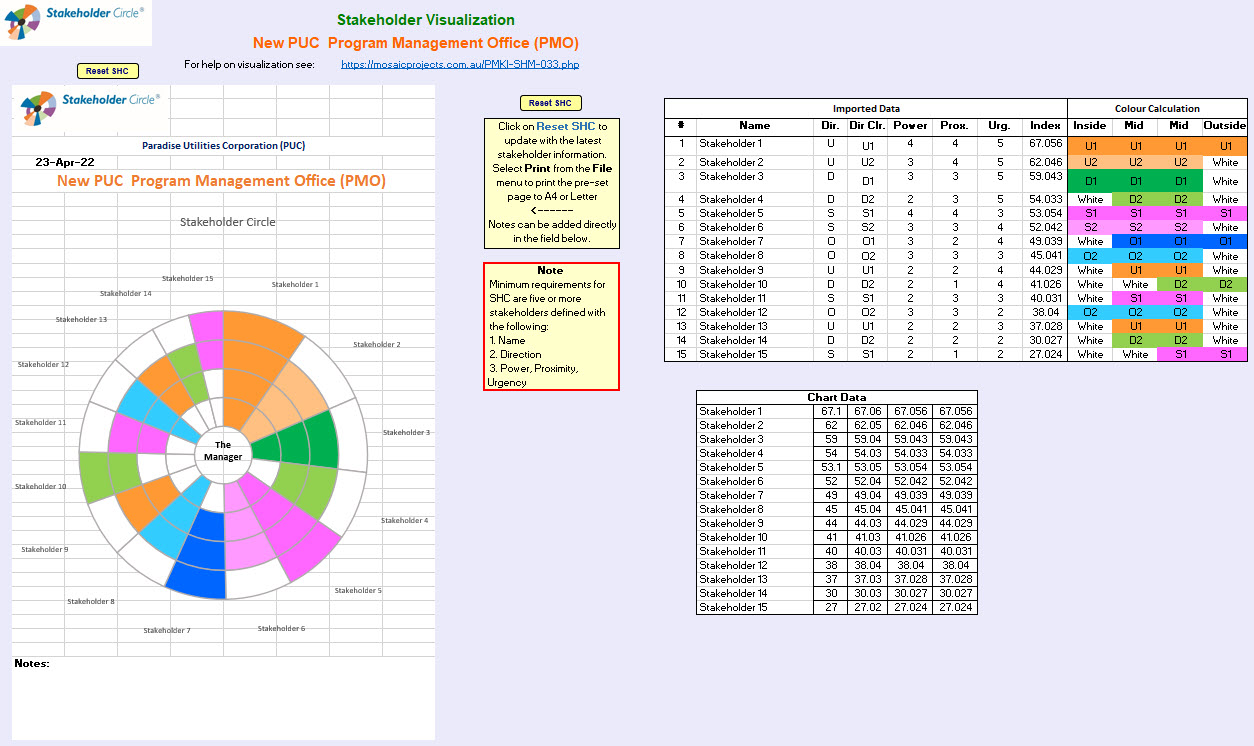
To create the current Stakeholder Circle,
click on the Reset SHC button.
The data used to build the stakeholder circle is imported
to the data tables (these are locked and cannot be
edited), and the new Stakeholder Circle,
is generated. If required, notes can be added to the note
field under the chart for printing. To edit any of the
information displayed return to the Identification,
or Prioritization tabs.
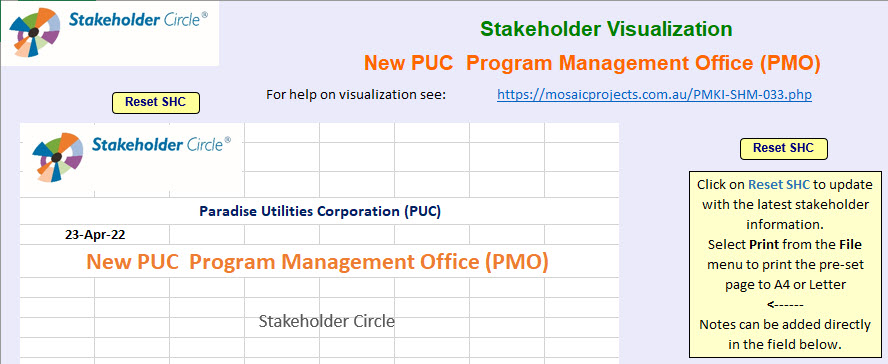
Use the normal Excel print options to print the chart. The print area is set to fit both A4 and US Letter paper at 100%.
Stakeholder Engagement Index
If the attitude of stakeholders have been assessed as part of the engagement process, the Stakeholder Index is included on the report.
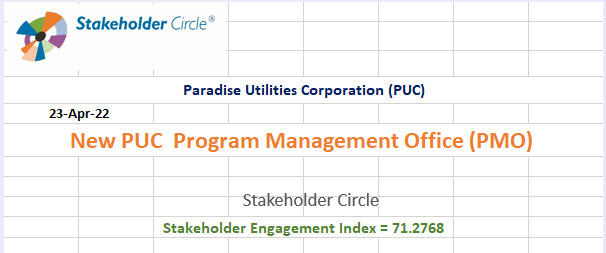
The index is in the range 0 (low) to 100 (high), and is based on the average supportiveness and receptiveness of the assessed stakeholders. A full description of the Stakeholder Engagement Index is on the Engagement page - see more.
The Stakeholder Circle helps you visualize the important members of the stakeholder community at a point in time, and to observe changes as stakeholder assessments are updated.The data collected through the identification and prioritization processes is used to create a map of the key members of the community. The diagram is designed to facilitate decisions on where the team need to concentrate their stakeholder engagement effort. These insights are the foundation needed for the development and implementation of a targeted communication plan.
Size and Position
 The
Stakeholder Circle represents the work surrounded by its
stakeholder community. All dimensions of the stakeholder
analysis are relative to the person managing, or leading,
the work, for example, Downwards represents the team
members working for the leader. This person, and the work
they are managing are at the center of the circle.
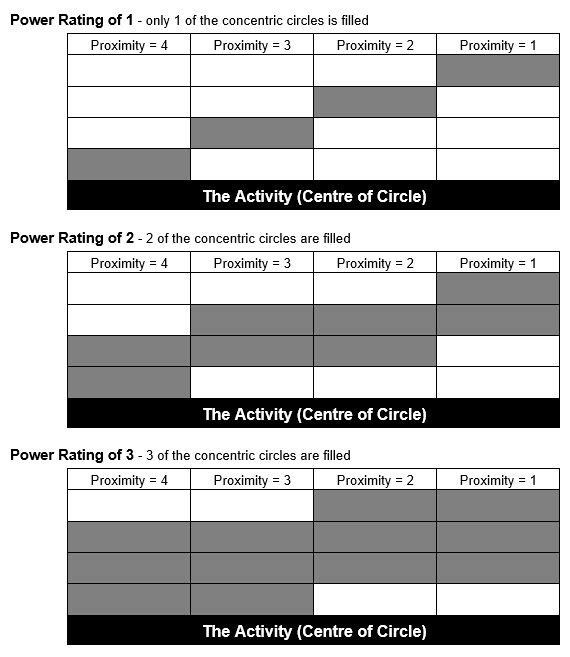
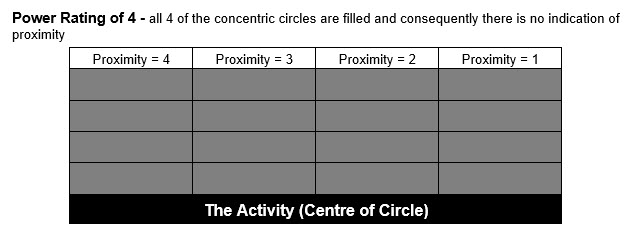
Four concentric circles represent the proximity of the stakeholders to the work, and their power. The closer the stakeholder is to the work, the nearer it will be drawn to the center of the circle. Each stakeholder is represented by a segment of the circle.
The stakeholder's name is printed adjacent to the segment
representing the stakeholder.
The power of the stakeholder is represented by the radial
depth of the segment:
- Stakeholder 1 has a power of 4 and can terminate,
or fundamentally change, the project, the
segment
cuts the circle.
- Stakeholder 3 has a power rating of 2, a significant
informal capacity to cause change, this
stakeholder
is also close to the work, possibly a team
member.
The importance of each stakeholder and their degree of influence is indicated by the relative size of each segment measured on the outer circumference of the circle. The larger the segment, the more influential the stakeholder.
The most important stakeholder (with the highest level of influence) is plotted in position 1, starting at 12:00 o'clock. The second most important next, through to a maximum of 15 stakeholders displayed.
Power & Proximity
Power and proximity values interact on the same dimension. Power is the primary rating; the proximity rating positions the segment if the power rating is less than 4. As discussed above, the radial depth of each segment is determined by the power rating; a low power rating of 1 only occupies one of the 4 concentric circles, a high-power rating of 4 occupies all 4 concentric circles. For power ratings less than 4, the proximity rating determines the positioning of the segment within the stakeholder circle as shown in the following tables:
Colors and Patterns
Color coding is based on the direction of influence of these key stakeholders:
To differentiate adjacent stakeholders within the same categorization two different shades of the directional colour are used, this difference in shading serves no other purpose. The allocation of a particular shading is determined during the creation of the Stakeholder Circle, and is dependent on the current sequence of stakeholders in the top 15. This means the same stakeholder may have a different shading allocated at different times depending on its position in the list.